Silent Agent Failures: Agent Observability Beyond Status OK
Traces that finish with status OK can still break policy, invent numbers or give up. A taxonomy of silent agent failures, the signals that reveal them and how to catch them on every trace.
Your agent handled 40,000 conversations yesterday. Every trace ended with status OK. Latency was normal, no exceptions fired and the error dashboard stayed green. Somewhere in that pile, the agent refunded an order that was 47 days old, quoted a delivery date it made up and told a customer it could not help with something it was built to do.
These are silent failures: traces that complete without an error and still do the wrong thing. They are the most expensive failures an agent produces, because nobody finds them until a customer complains, finance spots the refund or a churned account shows up in a quarterly review.
This article gives you a working taxonomy of silent failures with examples, explains why logs, APM and error alerts cannot see them, lists the signals in a conversation that give them away, and lays out a method for catching them by checking every trace. That method is the core of agent observability: knowing not just whether your agent responded, but whether it did the right thing.
What counts as a silent failure
A silent failure has three properties. The trace finishes. No component raises an error. The outcome is wrong for the user, the business or both.
Traditional software rarely fails this way at scale. When a function gets bad input, it throws. When an API is down, you get a 500. Agents are different because the model is the control flow. It decides which tool to call, with which arguments and what to say about the result. A wrong decision is still a valid decision from the runtime's point of view. The HTTP call succeeds, the JSON parses and the response streams back to the user.
That is why agent failure detection has to look at meaning, not just mechanics. The question is not "did it crash?" but "was it right?"
A taxonomy of silent failures
Most silent failures fall into five groups. Naming them matters, because each one needs a different check.
1. Wrong tool arguments
The agent calls the right tool with the wrong input. It passes the customer's account ID where the order ID belongs, searches for "March" when the user said "last month" in September, or sets amount to the order total when the user asked for a partial refund. The tool accepts the input and returns a valid result for the wrong question. See agent tool call failures for a deeper look at this group.
2. Ungrounded numbers and claims
The agent states a fact that does not appear in any tool output or retrieved document. A shipping estimate of "3 to 5 business days" when the carrier API returned nothing. A price that was correct last quarter. A plan limit copied from its training data rather than your pricing page. Numbers are the worst case because they sound precise.
3. Policy violations
The agent does something your rules forbid. The running example for this article: a customer-support agent that issues refunds sometimes calls issue_refund before calling check_refund_policy, and refunds orders outside the 30-day window. Other examples: sharing another customer's data, promising a discount it cannot give or giving medical or legal advice it was told to avoid.
4. Stale flows
The agent follows a process that used to be correct. You changed the returns flow to require a photo, but the system prompt still describes the old one. You deprecated a tool, but the agent still reaches for it and falls back to a generic answer. Stale flows often appear right after a release and affect a narrow slice of traffic, which makes them easy to miss.
5. Giving up
The agent says "I'm unable to help with that" or hands off to a human for a request it should have handled. From the system's view, the trace is a clean success: fast, cheap, no errors. From the user's view, the product did not work. Giving up is often the result of an over-cautious prompt change or a tool that started returning an empty result.
Why logs, APM and error alerts miss them
Your existing stack is built to answer different questions. Each tool is good at its job, and none of them was designed to judge an agent's decisions.
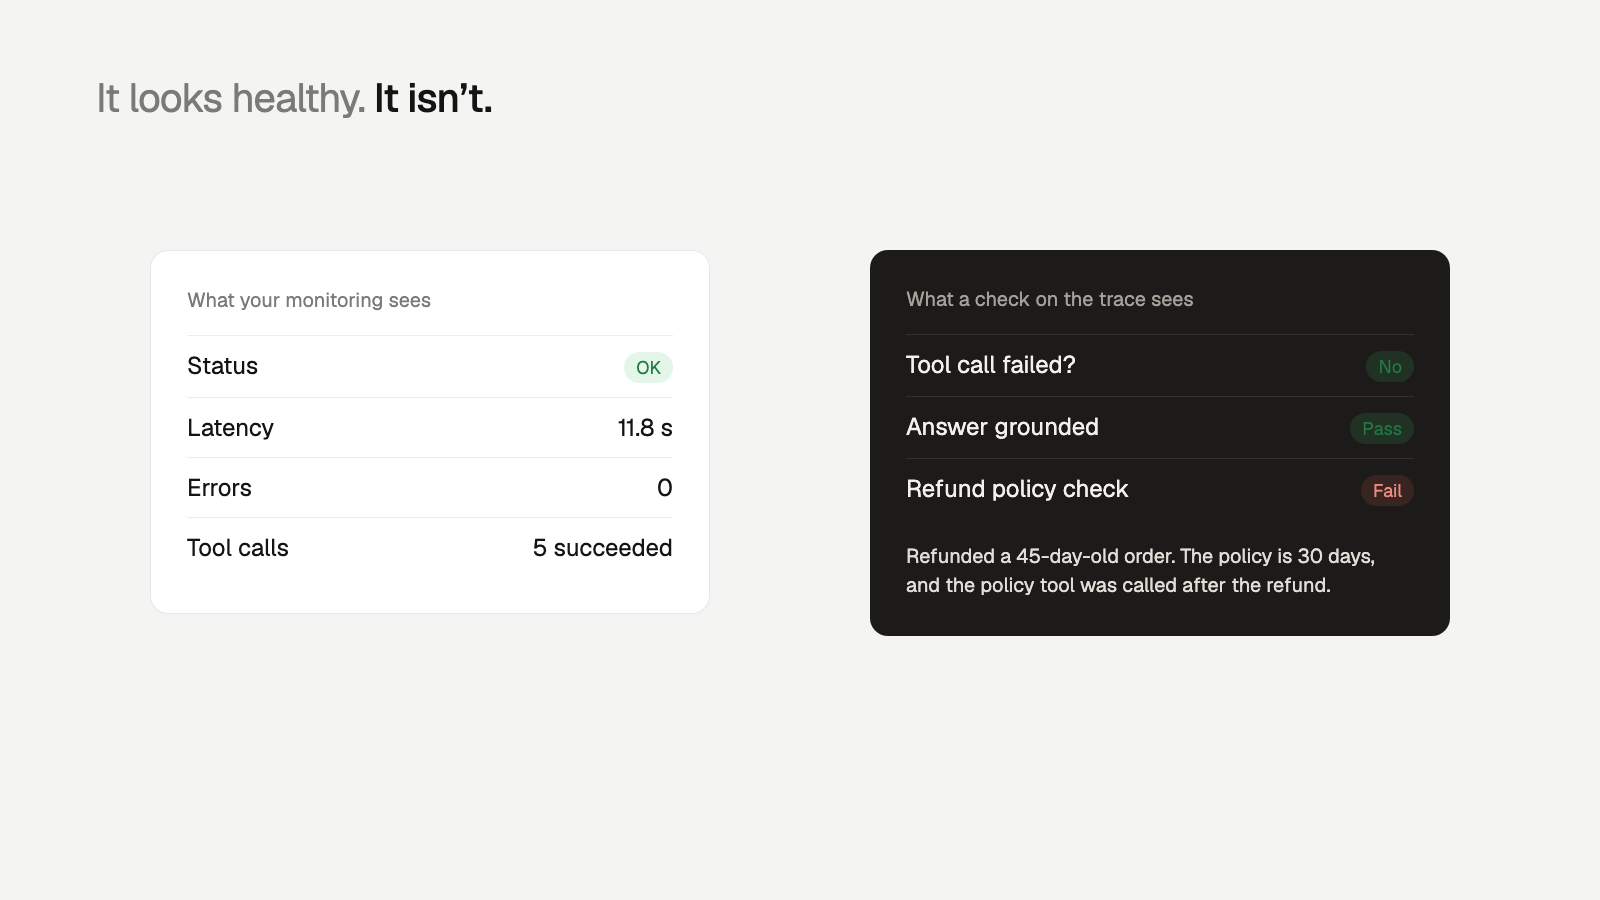
- Logs record what happened, not whether it was correct. A log line that says issue_refund(order_id=8812, amount=64.00) -> 200 looks identical whether the order was 5 days old or 47.
- APM measures latency, throughput and error rates. A silent failure is often faster than a correct trace, because the agent skipped a step. Giving up is the fastest trace of all.
- Error alerts fire on exceptions and non-2xx responses. Silent failures produce neither, by definition.
- Sampled manual review catches some of them, but a team reading 50 traces a week out of 280,000 will see the common failures and miss the rare ones that cost the most.
The gap is structural. These tools inspect the envelope of the trace. Silent failures live in its content: the arguments, the claims and the order of steps. To find them you need something that reads each trace and decides whether it passed.
Signals that reveal silent failures
Before you write a single check, the conversation itself often tells you something went wrong. Users react to bad answers, and their reactions leave marks in the trace.
- User corrections. "No, I meant the other order." "That's not what I asked." A correction in the next turn is strong evidence the previous turn failed.
- Retries. The same user sends the same or a near-identical request within a few minutes, often in a new session.
- Rephrasing. The user asks the same question with different words, adds detail or switches to shorter commands. They are trying to work around the agent.
- Escalation requests. "Let me talk to a person." This is useful even when the agent handled it correctly, because the rate should be stable across versions.
- Abandonment. The session ends right after the agent's answer, with no confirmation or thanks, on a flow that normally ends with an action.
- Downstream reversals. A refund reversed by finance, a ticket reopened, an order canceled within an hour of the agent's confirmation.
These signals are noisy on a single trace, but strong in aggregate. A jump in rephrasing rate for one intent after a prompt change is one of the earliest warnings you will get. Tracking them per intent and per agent version is a good first step in agent analytics.
Worked example: the refund that looked fine
Here is a trace from the refund agent. The user writes: "I want my money back for order 8812, the jacket didn't fit."
- The agent calls get_order(8812). It returns the order, placed 47 days ago, total $64.00.
- The agent calls issue_refund(order_id=8812, amount=64.00). The payments API returns success.
- The agent replies: "Done! Your refund of $64.00 is on its way and should appear in 5 to 7 business days."
- The trace ends. Status OK. Latency 2.1 seconds. Cost well under a cent.
Every infrastructure metric says this trace is healthy. It has two silent failures. The agent never called check_refund_policy, so it refunded an order outside the 30-day window: a policy violation. And the "5 to 7 business days" came from nowhere: no tool returned that figure, so it is ungrounded.
Now scale it. Say the agent handles 3,000 refund requests a day and 2% hit this path. That is 60 bad refunds a day that no alert will ever mention. A reviewer sampling 20 traces a day will see roughly one every two days, and only if they read it closely enough to check the order date.
How to catch silent failures: check every trace
The fix is to turn your expectations into checks and apply them to every production trace, not a sample. Rare failures are the reason: a 5% sample of a failure that affects 1 in 500 traces gives you almost nothing to act on. The trade-offs are covered in trace sampling vs full coverage.
Here is a method you can apply with any tooling:
- Capture full traces. You need every span: LLM calls, tool calls with arguments and outputs, and the final answer. Without tool arguments you cannot see failure types 1 and 3.
- Write one check per failure type. Start with the taxonomy above and your agent's actual rules. Each check should return pass or fail, plus a reason.
- Use the cheapest check that can decide. Policy ordering is a code check. Grounding needs a semantic comparison between the answer and tool outputs. Tone or giving up may need a model.
- Group failures by cause. Sixty failing refund traces are one problem, not sixty. Group by failing step and check so you fix the cause once.
- Track the conversation signals alongside. When corrections or retries spike for an intent with no failing checks, you are missing a check.
The policy check for the refund agent is a few lines of code over the trace's tool calls:
Code checks like this are free and exact. The harder part is grounding and giving up, where you need to compare meaning. Sending every trace to a frontier LLM judge works but gets expensive fast at production volume, which is why ordering checks from cheap to expensive matters.
Where Trodo fits
Trodo is an agent evaluation and observability platform built around this method. It records every trace your agent produces, including spans, LLM calls, tool calls, tokens, cost and latency, through Python and Node.js SDKs, OpenTelemetry ingest or auto-instrumentation for common frameworks.
It then evaluates every production trace with checks arranged as a decision tree. Cheap code checks decide first, such as whether issue_refund came before the policy tool. Semantic checks handle grounding. Trodo's own models, trained for calibrated pass/fail decisions, settle most of the rest, and an LLM judge only sees the traces those cannot settle. That is what makes full coverage affordable, at a fraction of LLM-judge cost.
Failures that share a cause become issues with the failing step, evidence and affected users, and each issue comes with a proposed fix to the agent or the check. Orbt uses this to check 100% of its production traces and cut the time from error to shipped fix from days to under 4 hours (case study).
Getting started
Start with the refund-style failure in your own agent: the one rule that must never break. Write it as a check, apply it to a day of traces and count the failures. Most teams find more than they expected.
To do it on every trace, create a free Trodo account. The Developer plan is free forever and includes 1,000 executions a month, with every feature on every plan. See pricing for Pro limits.