Agent Tracing with OpenTelemetry: A Step-by-Step Guide
A practical guide to agent tracing with OpenTelemetry: how to model LLM calls, tool calls and retrievals as spans, which attributes to record, and how to keep context across services and background jobs.
An agent that answers a support ticket might call a model three times, search a knowledge base, call two tools and hand work to a background job. When the answer is wrong, a log line that says status=200 tells you nothing. You need to see every step, in order, with inputs, outputs, tokens and timing. That is agent tracing.
OpenTelemetry is the obvious way to do it. It is vendor neutral, it already traces your HTTP services and databases, and it now has semantic conventions for LLM and agent workloads. The hard part is not installing it. The hard part is deciding what a span is, which attributes matter, and how to keep one trace intact when work hops across services and queues.
This guide walks through OpenTelemetry LLM tracing step by step in Python: the span model for an agent, the GenAI attributes, context propagation, what to add for debugging, exporting to a backend, and the pitfalls that quietly break traces in production.
Step 1: Model the agent as a span tree
A trace is one request from start to finish. Each unit of work inside it is a span with a start time, an end time, a status and attributes. Spans nest, so the trace becomes a tree. For an agent, a clean tree has four kinds of span:
- Agent span (the root): one per user request. Holds user, conversation and version attributes.
- LLM span: one per model call. Holds model name, token usage and finish reason.
- Tool span: one per tool execution. Holds tool name, call id, arguments and error status.
- Retrieval span: one per search or vector lookup. Holds the query, document ids and scores.
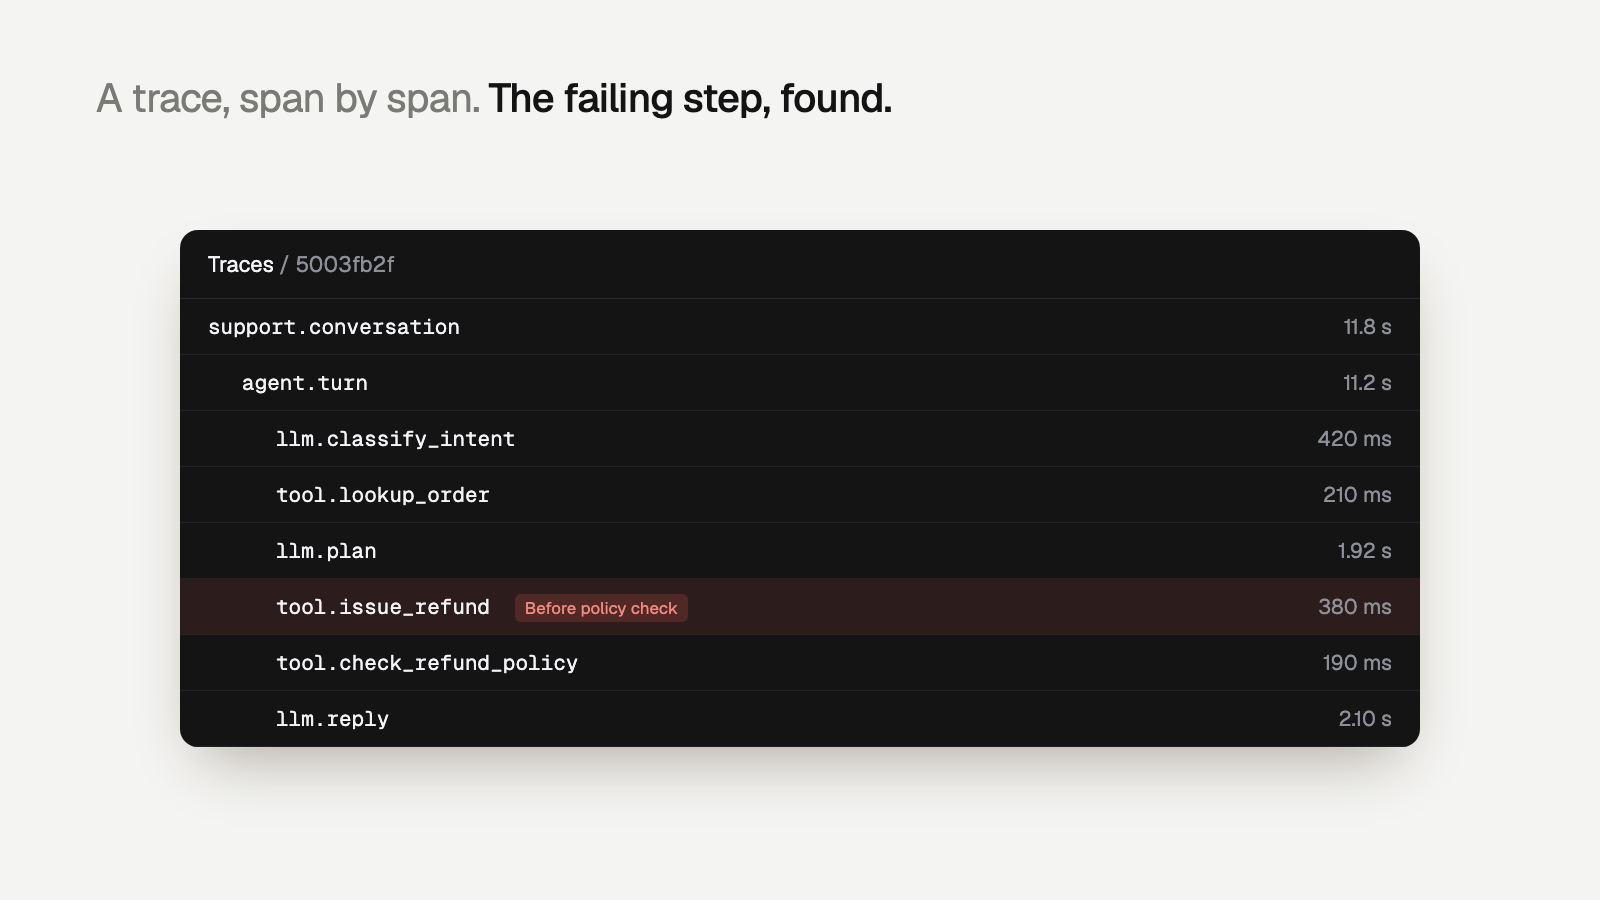
Take a customer-support agent that issues refunds. A healthy trace looks like: agent span, retrieval of the refund policy, an LLM call that decides to call check_refund_policy, the tool span, a second LLM call that calls issue_refund, then the final answer. A broken trace skips the policy tool and refunds an order that is 45 days old. With a span tree, that difference is visible at a glance.
Step 2: Set up the tracer and exporter
Configure a TracerProvider once at startup. Give it a service.name so traces from the agent, the API and the workers are distinguishable. Use a BatchSpanProcessor so export happens off the request path, and an OTLP exporter so you can switch backends by changing environment variables.
If your stack uses auto-instrumentation libraries for OpenAI, Anthropic or LangChain, they will create LLM spans for you. You still want manual spans for the agent root, your own tools and retrieval, because that is where most business logic lives.
Step 3: Add spans for LLM calls, tools and retrievals
Here is the support agent instrumented with tracer.start_as_current_span and set_attribute. Each with block opens a child of whatever span is current, so the tree builds itself.
Two details matter. First, tool spans call record_exception and set an error status, so a failed tool is a failed span and not just a log line. Second, span names are low cardinality (chat gpt-4o, execute_tool issue_refund), which keeps them groupable. Put the variable parts in attributes, not names.
Step 4: Use the GenAI semantic conventions
OpenTelemetry's GenAI semantic conventions define a shared vocabulary for LLM and agent spans. Following them means your traces read the same in any backend, and auto-instrumented spans line up with the ones you write by hand. At a general level, the attributes you will use most are:
- gen_ai.operation.name: what the span does, such as chat, embeddings, execute_tool or invoke_agent.
- gen_ai.request.model and gen_ai.response.model: the model you asked for and the one that answered.
- gen_ai.usage.input_tokens and gen_ai.usage.output_tokens: token counts, the basis for cost.
- gen_ai.tool.name and gen_ai.tool.call.id: which tool, and which call from the model it answers.
- gen_ai.agent.name and gen_ai.conversation.id: which agent and which multi-turn conversation.
Step 5: Add the attributes you will actually debug with
Standard attributes tell you what happened. Your own attributes tell you to whom and under which version. Put them on the root agent span, under your own namespace such as app.*:
- User id (app.user.id): an internal id, never an email. Lets you answer "which users hit this failure?"
- Conversation id: ties the turns of one chat together so you can read the whole exchange.
- Prompt version (app.prompt.version): the single most useful attribute when a deploy makes answers worse. You can compare failure rates before and after.
- Agent or release version: the git sha or build number of the agent code.
- Tenant or plan: for B2B agents, failures often cluster by customer.
- Outcome: for the refund agent, app.refund.issued and app.refund.amount make policy checks trivial later.
A good test: when someone reports a bad answer, can you find their trace from the ticket in under a minute? If not, you are missing an id.
Step 6: Propagate context across services and background jobs
Inside one process, start_as_current_span tracks the parent through Python's context. Across process boundaries, you have to carry it yourself. HTTP instrumentation does this for you with the W3C traceparent header. Queues, cron jobs and task workers usually do not.
Say the refund agent hands high-value refunds to a review worker. Without propagation, the worker starts a new, orphaned trace, and you can no longer see that the refund decision and the review belong together. The fix is to inject the context into the job payload and extract it on the other side:
If a job serves many parent traces (a nightly batch, for example), start a new trace and add span links to the originals instead of forcing one parent. Links keep the relationship without producing a trace that lasts twelve hours.
Pitfalls that break agent traces in production
Personal data in spans
Prompts and completions are the most useful thing you can record and the most dangerous. They contain names, addresses and order details. Decide per field: record content by default only where you have a retention and access policy, redact before calling set_attribute, and use an OpenTelemetry Collector with a redaction or attribute processor as a second line of defense. Never put secrets or raw payment data in a span.
Span explosion
Creating a span per streamed token, per chunk of a retrieved document, or per loop iteration of an agent that loops 200 times will flood your backend and hide the steps that matter. Aggregate instead: one LLM span per call with token counts as attributes, span events for notable moments, and a cap on loop iterations that sets an attribute when hit.
Async and thread context loss
asyncio tasks inherit context, but thread pools do not. Tool calls fanned out to a ThreadPoolExecutor show up as separate root spans with no parent. Capture the context before submitting and attach it in the worker:
Lost spans on shutdown
The batch processor exports on a timer. Short-lived workers and serverless functions can exit before it flushes. Call provider.force_flush() at the end of a job, or the last spans of a failing trace, the ones you need, disappear.
Errors that are not errors
A tool that returns {"ok": false, "reason": "order not found"} with HTTP 200 is a failure your span will mark as OK. Set the span status from the tool's own result, not only from exceptions. For more on this class of problem, see silent agent failures and agent tool-call failures.
From traces to answers
Traces show you what happened. They do not tell you whether it was right. The refund trace that skipped the policy tool has every span marked OK. To catch it, something has to check each trace against rules like "check_refund_policy must precede issue_refund".
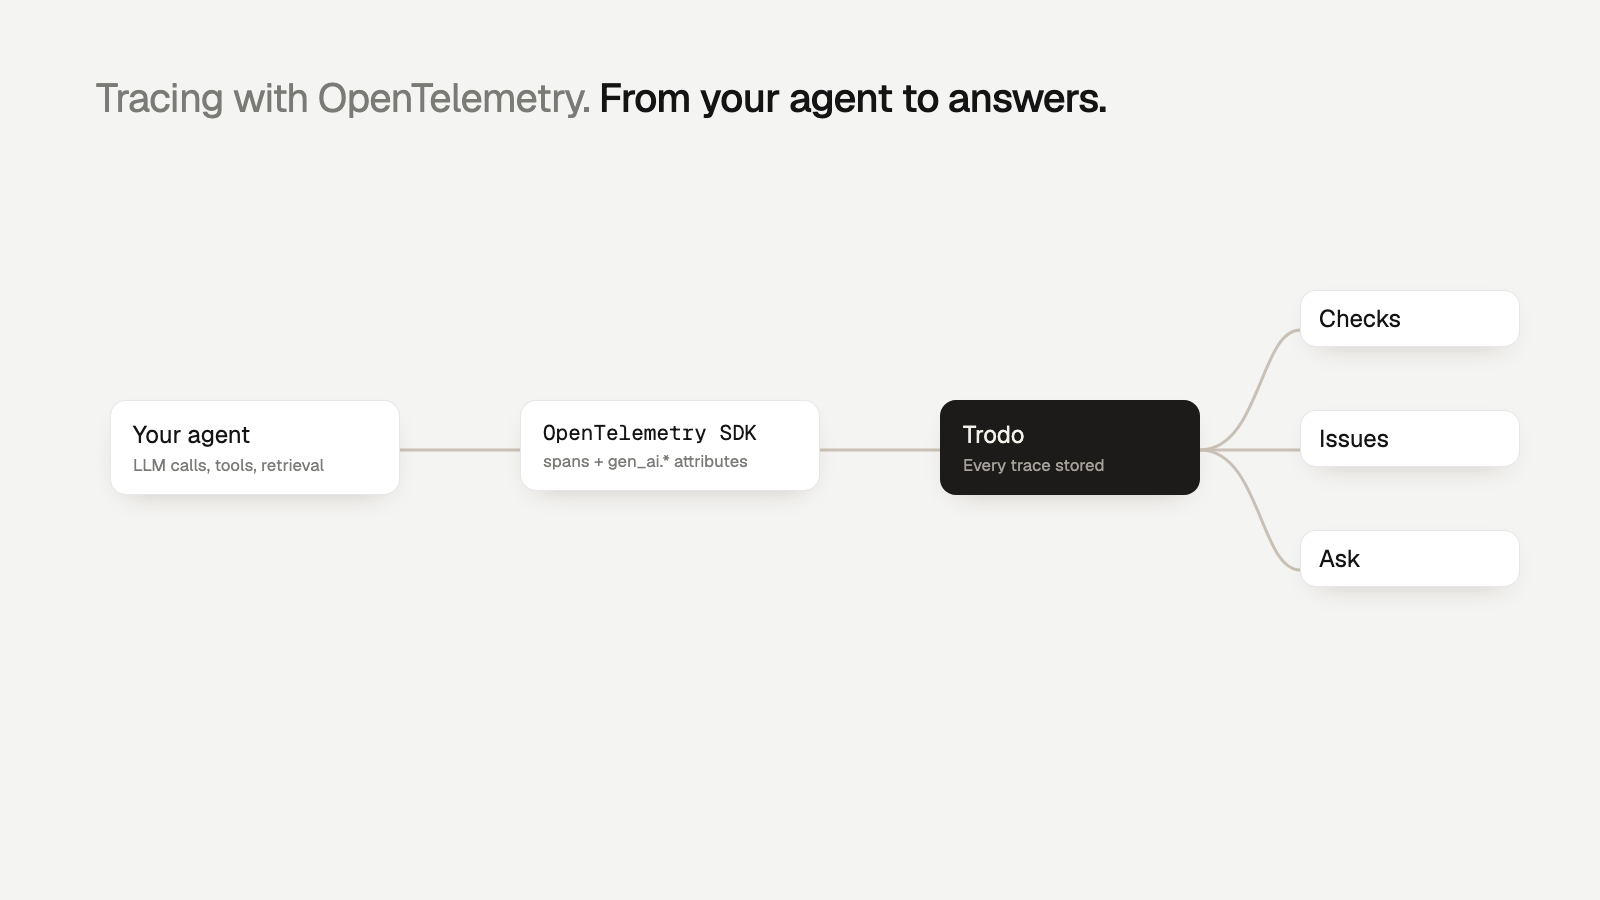
Trodo accepts OpenTelemetry over OTLP, so the instrumentation above works as is. Every trace that arrives is evaluated: cheap code checks decide first (did a tool fail, was the policy tool skipped), then semantic checks, then Trodo's own models, with an LLM judge only for the traces those cannot settle. Failures that share a cause are grouped into issues with the failing span, evidence and affected users, plus a proposed fix. It is the layer on top of tracing that turns spans into agent observability.
Getting started
Start small. Instrument the agent root span, your LLM calls and your tools this week, with user id, conversation id and prompt version on the root. Add context propagation to the first queue your agent touches. Then look at a day of traces and ask which failures you still cannot see.
If you want those traces checked automatically, create a free Trodo account and point your OTLP exporter at it, or follow the tracing quickstart to use the Python or Node.js SDK. The Developer plan is free, and every feature is on every plan; see pricing.